Challenges of Development & Validation of Deep Learning for Radiology
We have recently published an article on our deep learning algorithms for Head CT in The Lancet. This article is the first ever AI in medical imaging paper to be published in this journal. We described development and validation of these algorithms in the article. In this blog, I explain some of the challenges we faced in this process and how we solved them. The challenges I describe are fairly general and should be applicable to any research involving AI and radiology images.
Development
3D Images
First challenge we faced in the development process is that CT scans are three dimensional (3D). There is plethora of research for two dimensional (2D) images, but far less for 3D images. You might ask, why not simply use 3D convolutional neural networks (CNNs) in place of 2D CNNs? Notwithstanding the computational and memory requirements of 3D CNNs, they have been shown to be inferior to 2D CNN based approaches on a similar problem (action recognition).
So how do we solve it? We need not invent the wheel from scratch when there is a lot of literature on a similar problem, action recognition. Action recognition is classification of action that is present in a given video. Why is action recognition similar to 3D volume classification? Well, temporal dimension in videos is analogous to the Z dimension in the CT.
Left: Example Head CT scan. Right: Example video from a action recognition dataset. Z dimension in the CT volume is analogous to time dimension in the video.
We have taken a foundational work from action recognition literature and modified it to our purposes. Our modification was that we have incorporated slice (or frame in videos) level labels in to the network. This is because action recognition literature had a comfort of using pretrained 2D CNNs which we do not share.
High Resolution
Second challenge was that CT is of high resolution both spatially and in bit depth. We just downsample the CT to a standard pixel spacing. How about bit depth? Deep learning doesn’t work great with the data which is not normalized to [-1, 1] or [0, 1]. We solved this with what a radiologist would use - windowing. Windowing is restriction of dynamic range to a certain interval (eg. [0, 80]) and then normalizing it. We applied three windows and passed them as channels to the CNNs.
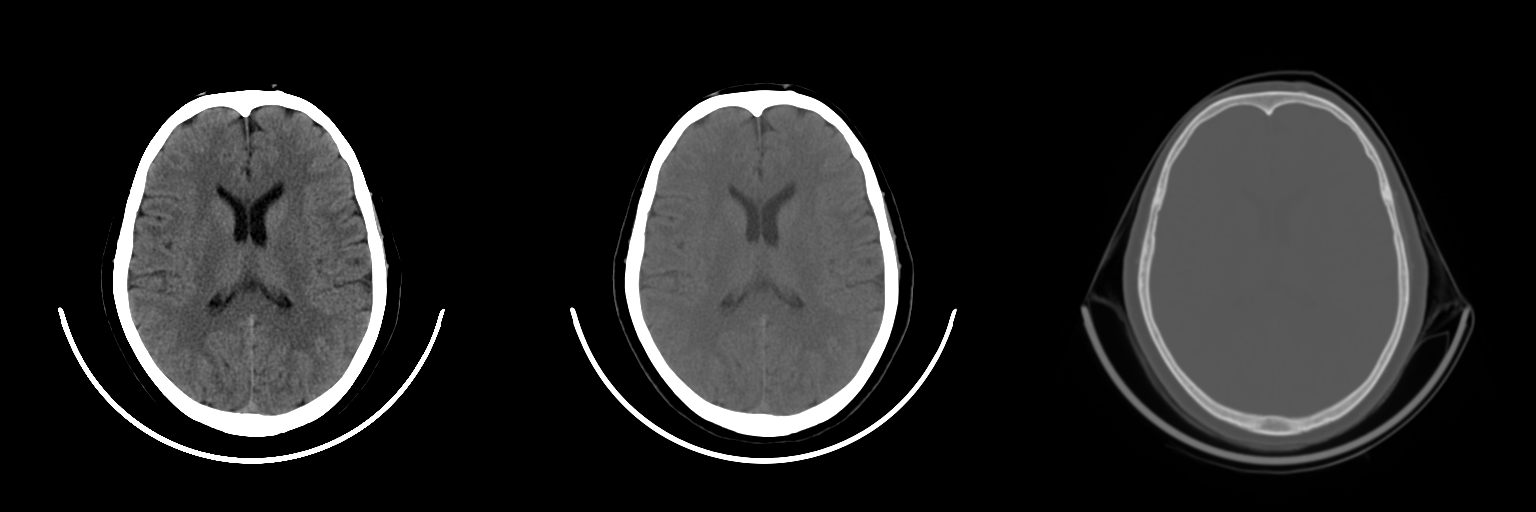
Windows: brain, blood/subdural and bone
This approach allows for multi-class effects to be accounted by the model. For example, a large scalp hemotoma visible in brain window might indicate a fracture underneath it. Conversely, a fracture visible in the bone window is usually correlated with an extra-axial bleed.
Other Challenges
There are few other challenges that deserve mention as well:
- Class Imbalance: We solved the class imbalance issue by weighted sampling and loss weighting.
- Lack of pretraining: There’s no pretrained model like imagenet available for medical images. We found that using imagenet weights actually hurts the performance.
Validation
Once the algorithms were developed, validation was not without its challenges as well. Here are the key questions we started with: does our algorithms generalize well to CT scans not in the development dataset? Does the algorithm also generalize to CT scans from a different source altogether? How does it compare to radiologists without access to clinical history?
Low prevalences and statistical confidence
The validation looks simple enough: just acquire scans (from a different source), get it read by radiologists and compare their reads with the algorithms’. But statistical design is a challenge! This is because prevalence of abnormalities tend to be low; it can be as low as 1% for some abnormalities. Our key metrics for evaluating the algorithms are sensitivity & specificity and AUC depending on the both. Sensitivity is the trouble maker: we have to ensure there are enough positives in the dataset to ensure narrow enough 95% confidence intervals (CI). Required number of positive scans turns out to be ~80 for a CI of +/- 10% at an expected sensitivity of 0.7.
If we were to chose a randomly sampled dataset, number of scans to be read is ~ 80/prevalence rate = 8000. Suppose there are three readers per scan, number of total reads are 8k * 3 = 24k. So, this is a prohibitively large dataset to get read by radiologists. We cannot therefore have a randomly sampled dataset; we have to somehow enrich the number of positives in the dataset.
Enrichment
To enrich a dataset with positives, we have to find the positives from all the scans available. It’s like searching for a needle in a haystack. Fortunately, all the scans usually have a clinical report associated with them. So we just have to read the reports and choose the positive reports. Even better, have an NLP algorithm parse the reports and randomly sample the required number of positives. We chose this path.
We collected the dataset in two batches, B1 & B2. B1 was all the head CT scans acquired in a month and B2 was the algorithmically selected dataset. So, B1 mostly contained negatives while B2 contained lot of positives. This approach removed any selection bias that might have been present if the scans were manually picked. For example, if positive scans were to be picked by manual & cursory glances at the scans themselves, subtle positive findings would have been missing from the dataset.
Prevalences of the findings in batches B1 and B2. Observe the low prevalences of findings in uniformly sampled batch B1.
Reading
We called this enriched dataset, CQ500 dataset (C for CARING and Q for Qure.ai). The dataset contained 491 scans after the exclusions. Three radiologists independently read the scans in the dataset and the majority vote is considered the gold standard. We randomized the order of the reads to minimize the recall of follow up scans and to blind the readers to the batches of the dataset.
We make this dataset and the radiologists’ reads public under CC-BY-NC-SA license. Other researchers can use this dataset to benchmark their algorithms. I think it can also be used for some clinical research like measuring concordance of radiologists on various tasks etc.
In addition to the CQ500 dataset, we validated the algorithms on a much larger randomly sampled dataset, Qure25k dataset. Number of scans in this dataset was 21095. Ground truths were clinical radiology reports. We used the NLP algorithm to get structured data from the reports. This dataset satisfies the statistical requirements, but each scan is read only by a single radiologist who had access to clinical history.
Results
| Finding | CQ500 (95% CI) | Qure25k (95% CI) |
|---|---|---|
| Intracranial hemorrhage | 0.9419 (0.9187-0.9651) | 0.9194 (0.9119-0.9269) |
| Intraparenchymal | 0.9544 (0.9293-0.9795) | 0.8977 (0.8884-0.9069) |
| Intraventricular | 0.9310 (0.8654-0.9965) | 0.9559 (0.9424-0.9694) |
| Subdural | 0.9521 (0.9117-0.9925) | 0.9161 (0.9001-0.9321) |
| Extradural | 0.9731 (0.9113-1.0000) | 0.9288 (0.9083-0.9494) |
| Subarachnoid | 0.9574 (0.9214-0.9934) | 0.9044 (0.8882-0.9205) |
| Calvarial fracture | 0.9624 (0.9204-1.0000) | 0.9244 (0.9130-0.9359) |
| Midline Shift | 0.9697 (0.9403-0.9991) | 0.9276 (0.9139-0.9413) |
| Mass Effect | 0.9216 (0.8883-0.9548) | 0.8583 (0.8462-0.8703) |
AUCs of the algorithms on the both datasets.
Above table shows AUCs of the algorithms on the two datasets. Note that the AUCs are directly comparable. This is because AUC is prevalence independent. AUCs on CQ500 dataset are generally better than that on the Qure25k dataset. This might be because:
- Ground truths in the Qure25k dataset incorporated clinical information not available to the algorithms and therefore the algorithms did not perform well.
- Majority vote of three reads is a better ground truth than that of a single read.
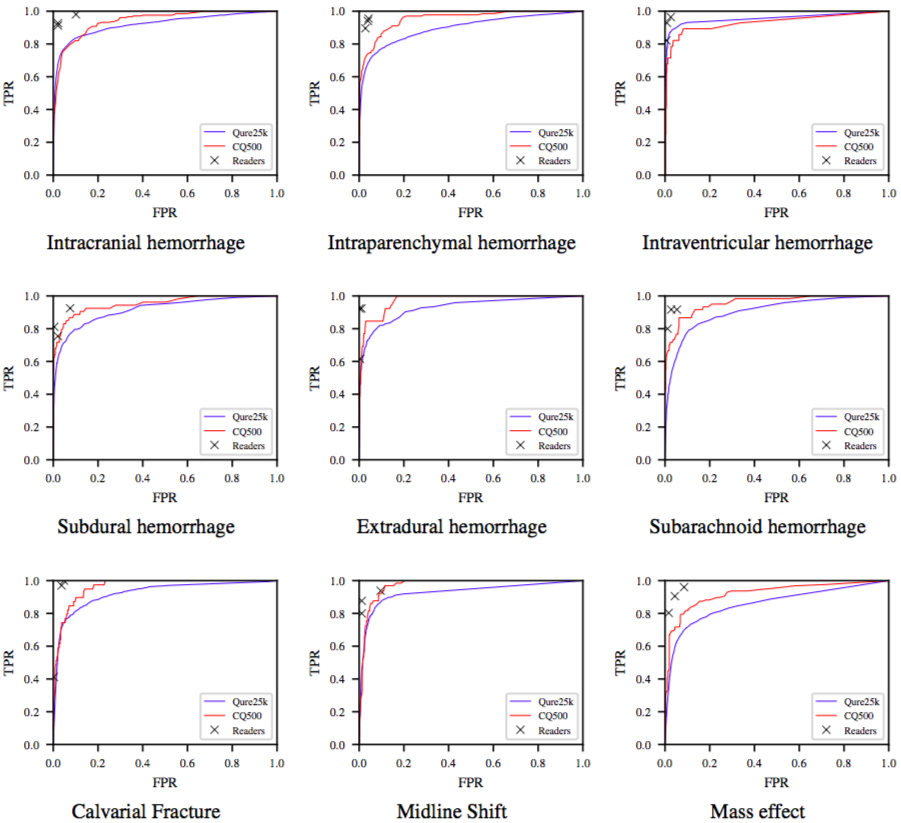
ROC curves for the algorithms on the Qure25k (blue) and CQ500 (red) datasets. TPR and FPR of radiologists are also plotted.
Shown above is ROC curves on both the datasets. Readers’ TPR and FPR are also plotted. We observe that radiologists are either highly sensitive or specific to a particular finding. The algorithms are still yet to beat radiologists, on this task at least! But these should nonetheless be useful to triage or notify physicians.