Morphology of the Brain: Changes in Ventricular and Cranial Vault Volumes in 15000 subjects with Aging and Hydrocephalus
This post is Part 1 of a series that uses large datasets (15,000+) coupled with deep learning segmentation methods to review and maybe re-establish what we know about normal brain anatomy and pathology. Subsequent posts will tackle intra-cranial bleeds, their typical volumes and locations across similarly sized datasets.
Brain ventricular volume has been quantified by post-mortem studies [1] and pneumoencephalography. When CT and subsequently MRI became available, facilitating non-invasive observation of the ventricular system larger datasets could be used to study these volumes. Typical subject numbers in recent studies have ranged from 50 - 150 [2-6].
Now that deep learning segmentation methods have enabled automated precise measurements of ventricular volume, we can re-establish these reference ranges using datasets that are 2 orders of magnitude larger. This is likely to be especially useful for age group extremes - in children, where very limited reference data exist and the elderly, where the effects of age-related atrophy may co-exist with pathologic neurodegenerative processes.
To date, no standard has been established regarding the normal ventricular volume of the human brain. The Evans index and the bicaudate index are linear measurements currently being used as surrogates to provide some indication that there is abnormal ventricular enlargement [1]. True volumetric measures are preferable to these indices for a number of reasons [7, 8] but have not been adopted so far, largely because of the time required for manual segmentation of images. Now that automated precise quantification is feasible with deep learning, it is possible to upgrade to a more precise volumetric measure.
Such quantitative measures will be useful in the monitoring of patients with hydrocephalus, and as an aid to diagnosing normal pressure hydrocephalus. In the future, automated measurements of ventricular, brain and cranial volumes could be displayed alongside established age- and gender-adjusted normal ranges as a standard part of radiology head CT and MRI reports.
Methods and Results
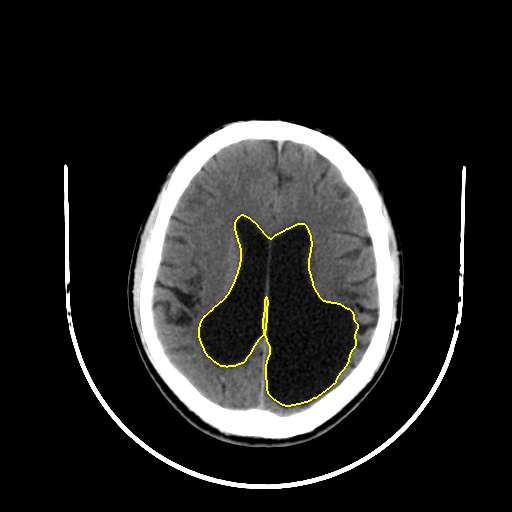
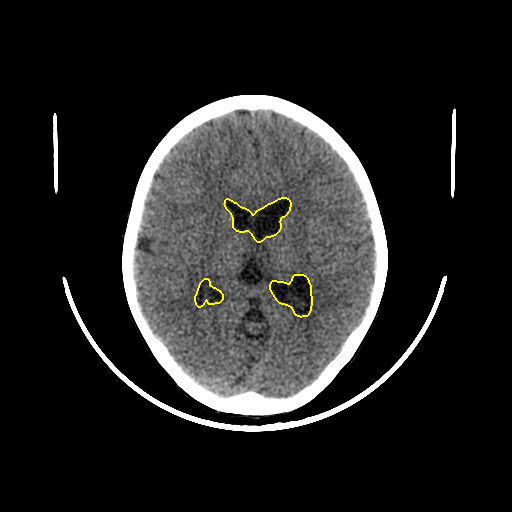
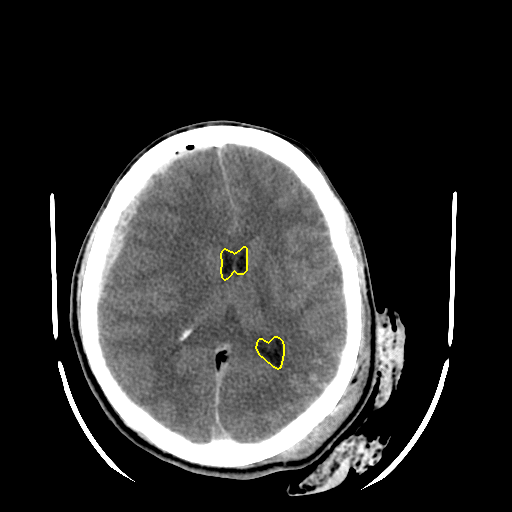
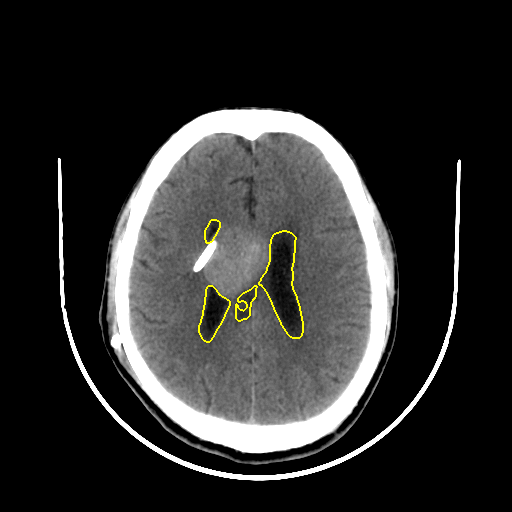
To train our deep learning model, lateral ventricles were manually annotated in 103 scans. We split these scans randomly with a ratio of 4:1 for training and validation respectively. We trained a U-Net to segment lateral ventricles in each slice. Another U-Net model was trained to segment cranial vault using a similar process. Models were validated using DICE score metric versus the annotations.
| Anatomy | DICE Score |
|---|---|
| Lateral Ventricles | 0.909 |
| Cranial Vault | 0.983 |
Validation set of about 20 scans might not have represented all the anatomical/pathological variations in the population. Therefore, we visually verified that the resulting models worked despite pathologies like hemorrhage/infarcts or surgical implants such as shunts. We show some representative scans and model outputs below.
| |
| |
To study lateral ventricular and cranial vault volume variation across the population, we randomly selected 14,153 scans from our database. This selection contained only 208 scans with hydrocephalus reported by the radiologist. Since we wanted to study ventricle volume variation in patients with hydrocephalus, we added 1314 additional scans reported with ‘hydrocephalus’. We excluded those scans for which age/gender metadata were not available. In total, our analysis dataset contained 15223 scans whose demographic characteristics are shown in the table below.
| Characteristic | Value |
|---|---|
| Number of scans | 15223 |
| Females | 6317 (41.5%) |
| Age: median (interquartile range) | 40 (24 - 56) years |
| Scans reported with cerebral atrophy | 1999 (13.1%) |
| Scans reported with hydrocephalus | 1404 (9.2%) |
Dataset demographics and prevalances.
Histogram of age distribution is shown below. It can be observed that there are reasonable numbers of subjects (>200) for all age and sex groups. This ensures that our analysis is generalizable.

We ran the trained deep learning models and measured lateral ventricular and cranial vault volumes for each of the 15223 scans in our database. Below is the scatter plot of all the analyzed scans.

In this scatter plot, x-axis is the lateral ventricular volume while y-axis is cranial vault volume. Patients with atrophy were circled with marked orange and while scans with hydrocephalus were marked with green. Patients with atrophy were on the right to the majority of the individuals, indicating larger ventricles in these subjects. Patients with hydrocephalus move to the extreme right with ventricular volumes even higher than those with atrophy.
To make this relationship clearer, we have plotted distribution of ventricular volume for patients without hydrocephalus or atrophy and patients with one of these.

Interestingly, hydrocephalus distribution has a very long tail while distribution of patients with neither hydrocephalus nor atrophy has a narrower peak.
Next, let us observe cranial vault volume variation with age and sex. Bands around solid lines indicate interquartile range of cranial vault volume of the particular group.
An obvious feature of this plot is that the cranial vault increases in size until age of 10-20 after which it plateaus. The cranial vault of males is approximately 13% larger than that of females. Another interesting point is that the cranial vault in males will grow until the age group of 15-20 while in the female group it stabilizes at ages of 10-15.
Now, let’s plot variation of lateral ventricles with age and sex. As before, bands indicate interquartile range for a particular age group.
This plot shows that ventricles grow in size as one ages. This may be explained by the fact that brain naturally atrophies with age, leading to relative enlargement of the ventricles. This information can be used as normal range of ventricle volume for a particular age in a defined gender. Ventricle volume outside this normal range can be indicative of hydrocephalus or a neurodegenerative disease.
While the above plot showed variation of lateral ventricle volumes across age and sex, it might be easier to visualize relative proportion of lateral ventricles compared to cranial vault volume. This also has a normalizing effect across sexes; difference in ventricular volumes between sexes might be due to difference in cranial vault sizes.
This plot looks similar to the plot before, with the ratio of the ventricular volume to the cranial vault increasing with age. Until the age of 30-35, males and females have relatively similar ventricular volumes. After that age, however, males tend to larger relative ventricular size compared to females. This is in line with prior research which found that males are more susceptible to atrophy than females[10].
We can incorporate all this analysis into our automated report. For example, following is the CT scan of an 75 year old patient and our automated report.
CT scan of a 75 Y/M patient.
Use scroll bar on the right to scroll through slices.
qER Analysis Report
===================

Patient ID: KSA18458
Patient Age: 75Y
Patient Sex: M

Preliminary Findings by Automated Analysis:

- Infarct of 0.86 ml in left occipital region.
- Dilated lateral ventricles.
  This might indicate neurodegenerative disease/hydrocephalus.
  Lateral ventricular volume = 88 ml.
  Interquartile range for male >=75Y patients is 28 - 54 ml.

This is a report of preliminary findings by automated analysis.
Other significant abnormalities may be present.
Please refer to final report.
Our auto generated report. Added text is indicated in bold.
Discussion
The question of how to establish the ground truth for these measurements still remains to be answered. For this study, we use DICE scores versus manually outlined ventricles as an indicator of segmentation accuracy. Ventricle volumes annotated slice-wise by experts are an insufficient gold-standard not only because of scale, but also because of the lack of precision. The most likely places where these algorithms are likely to fail (and therefore need more testing) are anatomical variants and pathology that might alter the structure of the ventricles. We have tested some common co-occurring pathologies (hemorrhage), but it would be interesting to see how well the method performs on scans with congenital anomalies and other conditions such as subarachnoid cysts (which caused an earlier machine-learning-based algorithm to fail [9]).
- Recording ventricular volume on reports is a good idea for future reference and monitor ventricular size in individuals with varying pathologies such as traumatic brain injury and colloid cysts of the third ventricle.
- It provides an objective measure to follow ventricular volumes in patients who have had shunts and can help in identifying shunt failure.
- Establishing the accuracy of these automated segmentation methods algorithms also paves the way for more nuanced neuroradiology research on a scale that was not previously possible.
- One can use the data in relation to the cerebral volume and age to define hydrocephalus, atrophy and normal pressure hydrocephalus.
References
- EVANS, WILLIAM A. “An encephalographic ratio for estimating ventricular enlargement and cerebral atrophy.” Archives of Neurology & Psychiatry 47.6 (1942): 931-937.
- Matsumae, Mitsunori, et al. “Age-related changes in intracranial compartment volumes in normal adults assessed by magnetic resonance imaging.” Journal of neurosurgery 84.6 (1996): 982-991.
- Scahill, Rachael I., et al. “A longitudinal study of brain volume changes in normal aging using serial registered magnetic resonance imaging.” Archives of neurology 60.7 (2003): 989-994.
- Hanson, J., B. Levander, and B. Liliequist. “Size of the intracerebral ventricles as measured with computer tomography, encephalography and echoventriculography.” Acta Radiologica. Diagnosis 16.346_suppl (1975): 98-106.
- Gyldensted, C. “Measurements of the normal ventricular system and hemispheric sulci of 100 adults with computed tomography.” Neuroradiology 14.4 (1977): 183-192.
- Haug, G. “Age and sex dependence of the size of normal ventricles on computed tomography.” Neuroradiology 14.4 (1977): 201-204.
- Toma, Ahmed K., et al. “Evans’ index revisited: the need for an alternative in normal pressure hydrocephalus.” Neurosurgery 68.4 (2011): 939-944.
- Ambarki, Khalid, et al. “Brain ventricular size in healthy elderly: comparison between Evans index and volume measurement.” Neurosurgery 67.1 (2010): 94-99.
- Yepes-Calderon, Fernando, Marvin D. Nelson, and J. Gordon McComb. “Automatically measuring brain ventricular volume within PACS using artificial intelligence.” PloS one 13.3 (2018): e0193152.
- Gur, Ruben C., et al. “Gender differences in age effect on brain atrophy measured by magnetic resonance imaging.” Proceedings of the National Academy of Sciences 88.7 (1991): 2845-2849.


